Sieger Bokschoten
Data Analysis and Visualization Portfolio of Sieger Bokschoten
Github profile: github.com/sieger1010 LinkedIn: linkedin.com/in/sieger-bokschoten/
GitHub Projects
Data Analytics
-
Standardized dataset of H-2A visa work orders from 2008 to present year - available to the public, and being continuously improved. Repository here: github.com/sieger1010/h2a. Visualization of the data is available on Tableau Public H-2A V2.
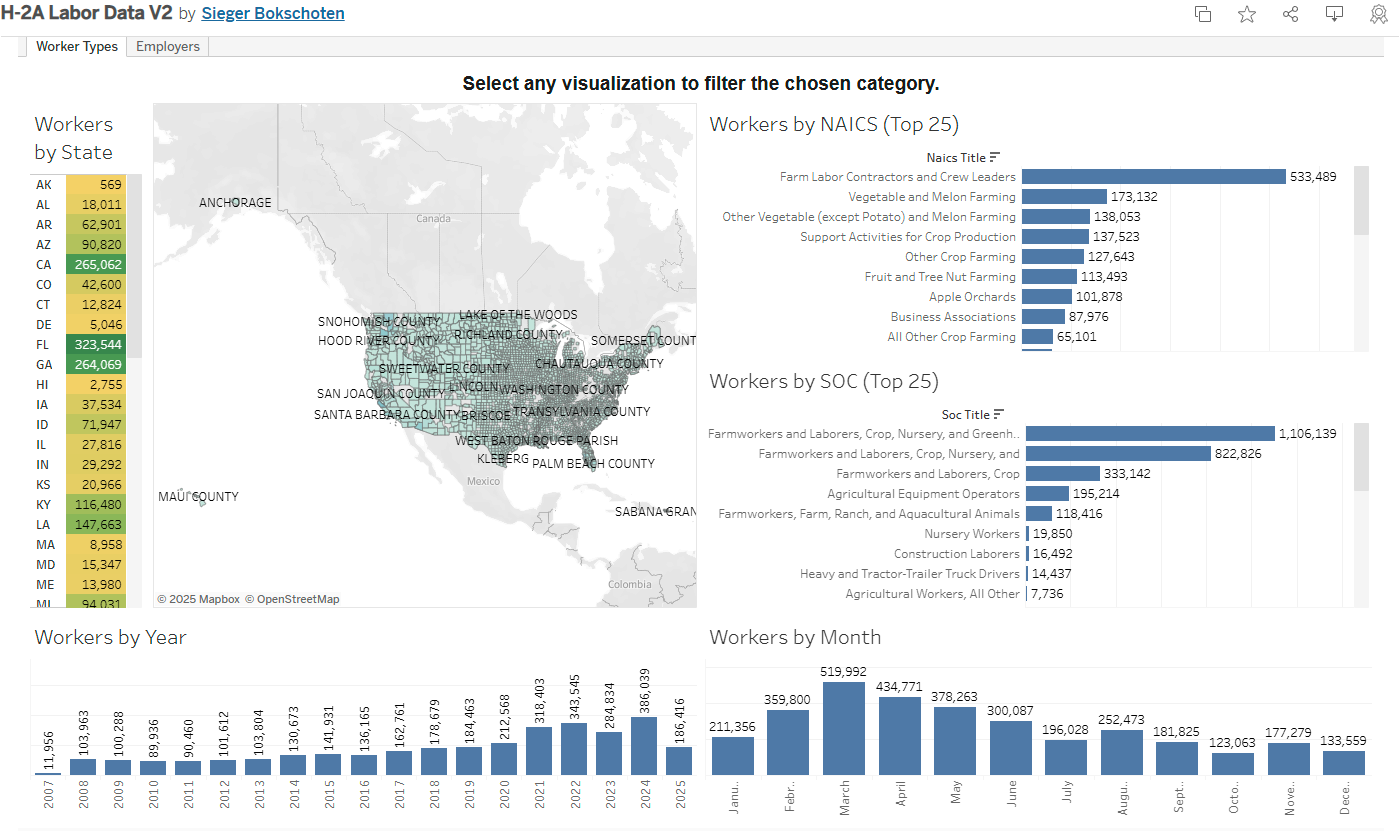
The purpose for this project is to gain a better understanding of the growth and effect the H-2A program has on agriculture, and to see which business are employing H-2A’s. This can allow nonprofits or other farmworker service providers to gain an understanding on where the farmworker population is within their state.
County level data, and historic data has not been easily accessible. These dashboards are intended to be used by nontechnical individuals to gain a geospatial understanding of farmwork in their local area. Previously, some organizations have published limited data, most often at the state level, and only for a few years. This dataset allows access to view individual county changes related to total workers hired, type of workers, and type of business.
Skills used: python, pandas, SQL, SQLite, Tableau, Data Analysis, Data Visualization, Markdown, GeoSpatial Analysis, Data Cleaning.
Web Applications
-
Choropleth maps showing USDA 2017 Census of Agriculture data at a county level. Originally created to determine the best location to open an office that would reach the greatest number of agricultural workers. Nine state maps were eventually created.
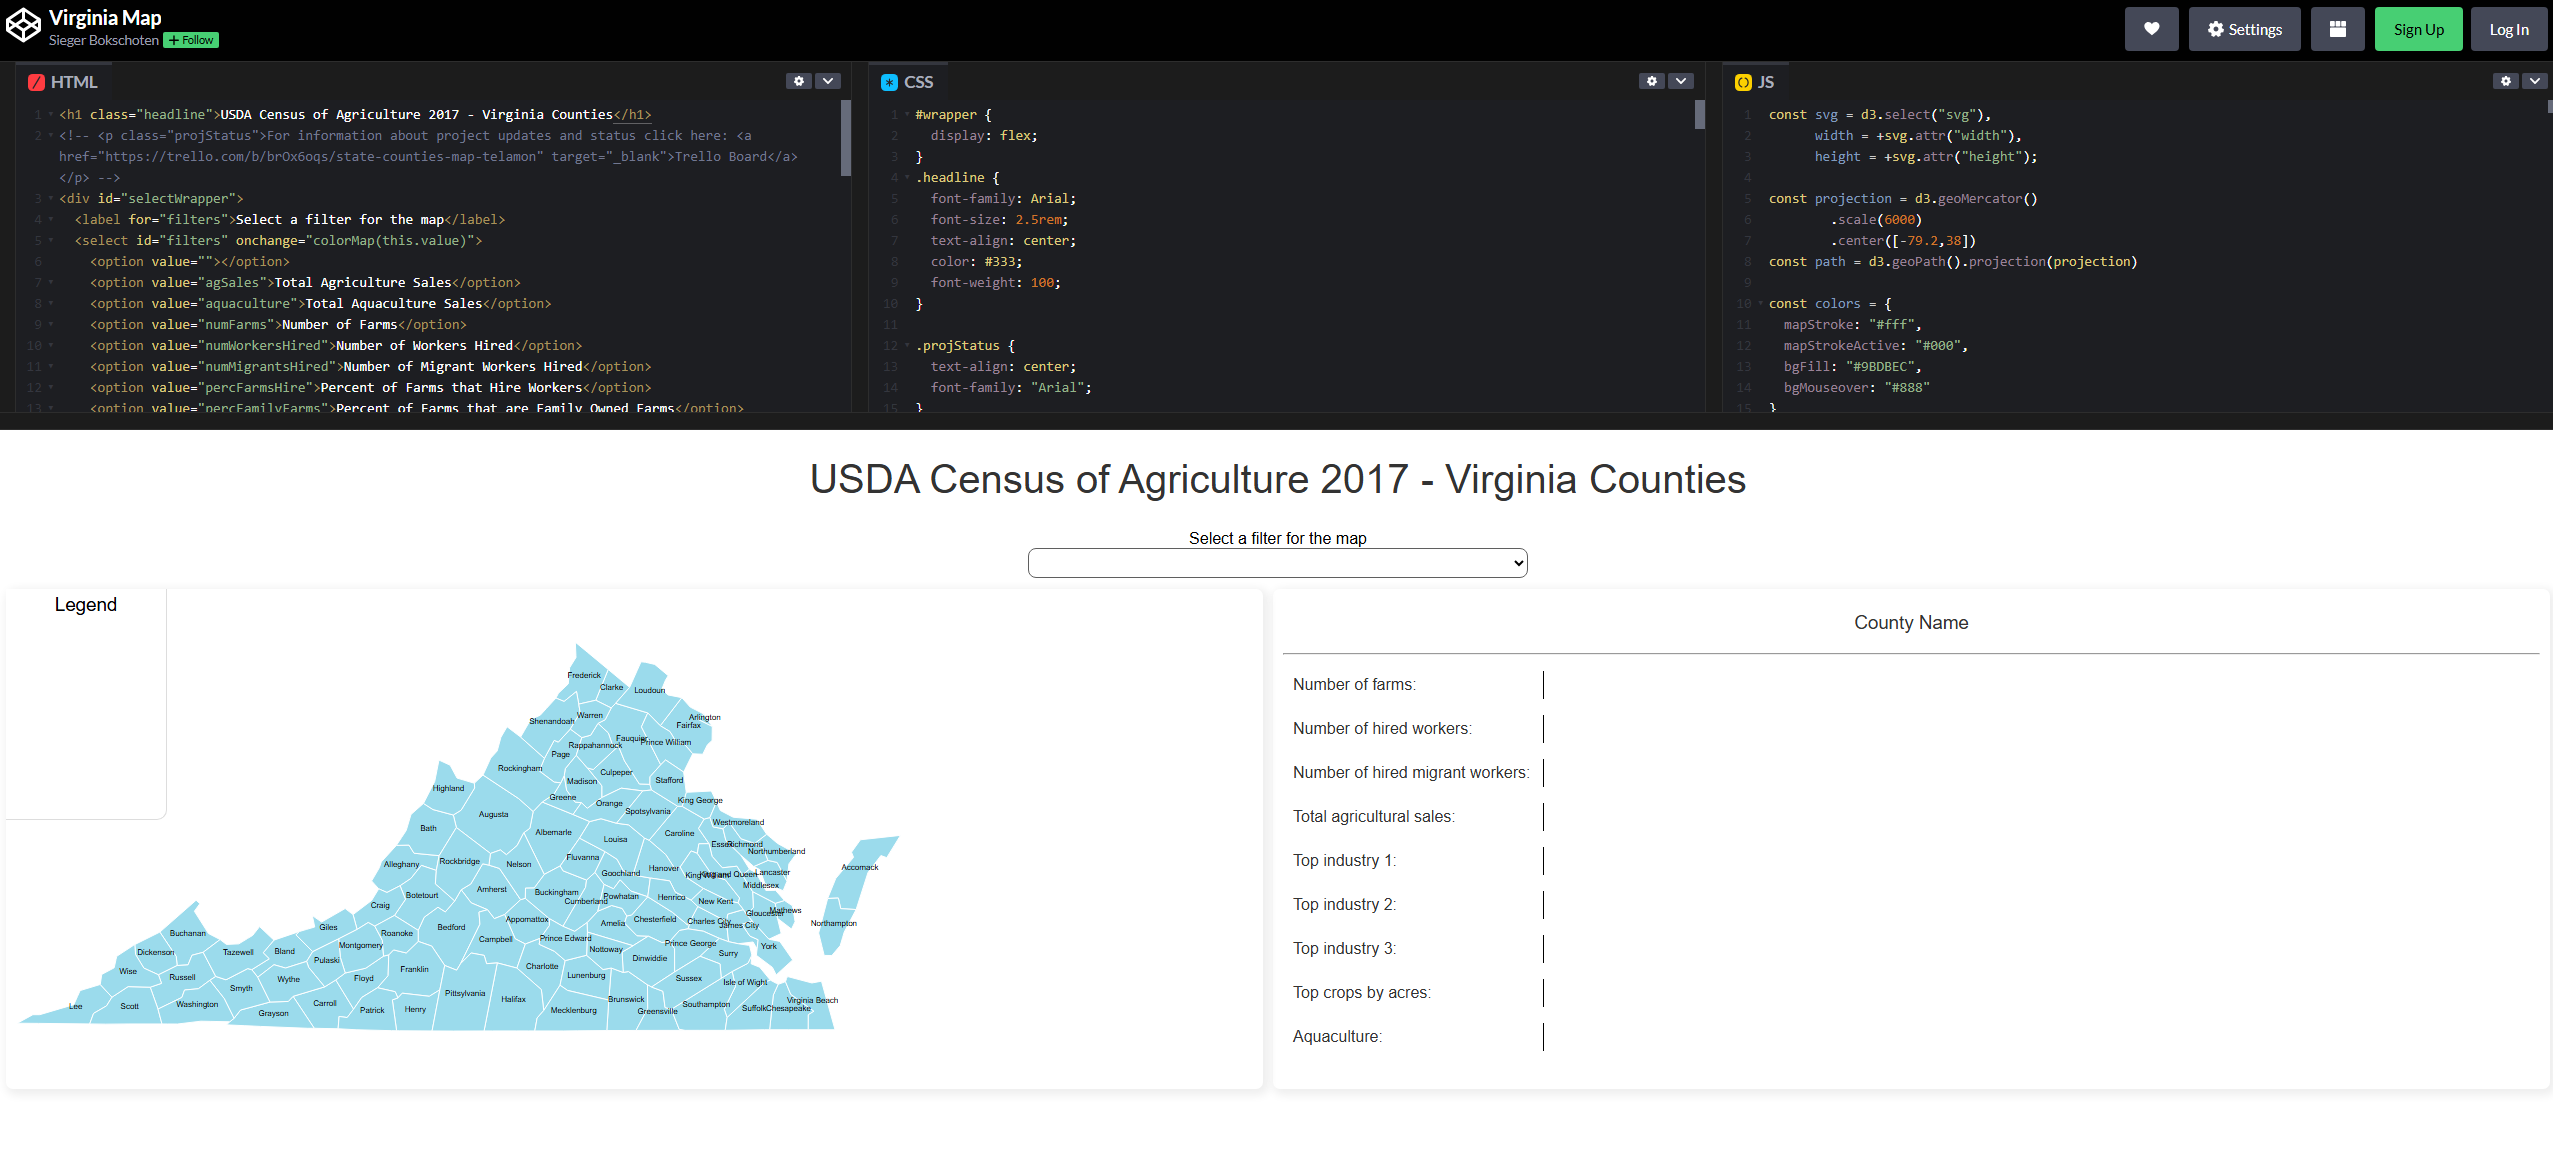
Goals for the project were to create something that didn’t require any maintenance, or incur any costs that would also be easy to view for non-technical individuals, and be as intuitive as possible.
Skills used: HTML, CSS, Javascript, D3.js, NodeJS, GeoJSON, Excel, Data Visualization, Data Analysis.
- Virginia codepen.io/Sieger/pen/VwdjZOJ
- Alabama codepen.io/Sieger/pen/GRPypmV
- Delaware codepen.io/Sieger/pen/qBLgdMm
- Georgia codepen.io/Sieger/pen/MWzbvVb
- Maryland codepen.io/Sieger/pen/ZEVmZRZ
- Michigan codepen.io/Sieger/pen/rNQmJvm
- North Carolina codepen.io/Sieger/pen/YzRPNLq
- South Carolina codepen.io/Sieger/pen/QWzJwpV
- West Virginia codepen.io/Sieger/pen/JjwxVaQ